
Economic Impact Snapshot Calculator
Tool Guide
A quick snapshot of your organisation’s economic impact from spending or investment.
This tool is designed for simple, transparent estimates — not a full economic evaluation.
NAVIGATION
QUICK START
WHAT TO ENTER
UNDERSTANDING YOUR RESULTS
WHAT TO ENTER
WHAT’S INCLUDED (AND NOT)
FAQS
HOW TO CITE & DISCLAIMER
QUICK START (2–3 MINUTES)
1) Choose a sector that best matches your activity.
2) Enter your Investment Amount (NZD).
3) Adjust Displacement if some activity would have happened anyway.
4) Download the 1‑page PDF snapshot for your report or funding application.

WHAT TO ENTER
Sector
Pick the primary sector you operate in.
For example, if you provide youth counselling services, select ‘Medical and other healthcare services’.
Investment Amount (NZD)
Enter the amount you want to test as an “economic injection”.
Good options include:
• A grant you received
• A project budget
• A new contract value
• Annual operational spend (if you want a yearly snapshot)
Tip: Use the amount that is most defensible for your audience (funder, board, partners). Keep it simple and consistent.
Prices include GST (15%)
Tick this if your number includes GST (most advertised prices do).
Leave it off if you are using GST‑exclusive figures (often used in accounting and budgets).
Displacement
Displacement is the share of activity that likely replaces other activity, rather than adding new activity.
If displacement is 0%, the tool treats the full amount as additional.
If displacement is 25%, the tool treats 25% as “would have happened anyway” and reduces results.
A simple way to set it:
0–10%: spending is genuinely new (new funding, new project)
10–40%: some substitution likely (mixed funding, mixed sources)
40%+: high chance it replaces other local spend
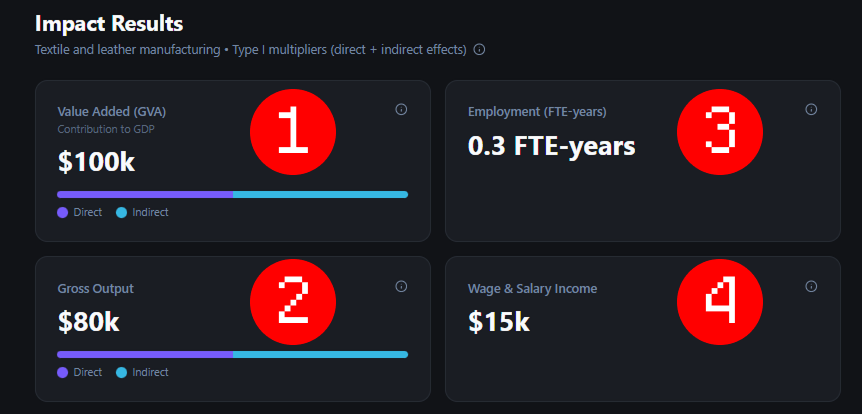
UNDERSTANDING YOUR RESULTS
This tool shows Type I effects:
Direct = impact in the sector you selected
Indirect = flow-on impacts through suppliers
Induced Impact on households - not shown, get in touch

You will see results for:
Value added (GDP contribution)
Output
Employment (FTE‑years)
Wage & salary income
What these results mean
Value added (GDP contribution)
Value added is the part of the activity that becomes GDP. It’s the “new value” created after paying for supplies. In simple terms, it’s closer to the real economic contribution than output. Value added mainly reflects wages paid to people, plus business profit and some taxes (less subsidies).Output (total economic activity)
Output is the total value of goods and services supported by the spending. Think of it like the total “turnover” created across the economy. It’s usually the largest number because it includes money that gets spent between businesses (for example, a contractor buying materials, then the supplier buying inputs).Employment (FTE-years)
This shows how much work is supported, measured in full-time equivalent years.1.0 FTE-year = one full-time job for one year
0.5 FTE-years = a half-time job for one year, or one full-time job for six months
It’s a good way to compare job impact without guessing how many permanent jobs were “created”
Wage & salary income
This is the total pay to workers supported by the activity, across the main sector and its suppliers. It’s not profit or tax; it's wages and salaries that go to households. This can help show how spending supports people’s incomes, not just business activity.
WHAT’S INCLUDED (AND NOT)
Included
Direct + indirect effects (Type I)
Simple displacement adjustment
A one‑page PDF export for reporting
Not included (in this free snapshot)
Induced (household) effects
Regional multipliers (local supply chains and “leakage”)
Detailed sensitivity testing and scenario ranges
Why you might need these missing pieces
Induced effects can increase totals because households spend additional wages in the economy.
Regional multipliers can change results because regions differ in local supply chains and how much spending stays local.
Household (induced) effects
Induced effects capture extra activity from household spending (wages → spending → more demand).
If you need induced effects for a funder or board report, contact us and we’ll advise the right approach for your context.
Regional multipliers
National averages can over‑ or under‑state local impacts.
Regional multipliers adjust for local supply chains, local purchasing, and spending that “leaks” out of the region.
If your audience cares about local impact (region, town, rohe), contact us to discuss a regional approach.
Frequently Asked Questions
-
No. This tool estimates economic activity (jobs, GDP contribution, output). Social impact focuses on outcomes for people and communities.
-
No. These are activity measures, not a cost‑benefit analysis.
-
Yes — as a high-level, transparent estimate. Use the PDF export and include the disclaimer.
-
Rounding avoids false precision. These are indicative estimates.
-
The tool is designed for quick “snapshot” use. For large investments, contact us for a tailored approach.
-
No. We do not store your inputs, collect any data on you, or save any of your results. This is simply a calculator
Citing and Disclaimer
HOW TO CITE
“Economic Impact Snapshot generated using Matatihi’s Economic Impact Snapshot Calculator (Type I multipliers, direct + indirect), based on Stats NZ Input–Output tables (year ended March 2020). Scenario run on [DATE].”
DISCLAIMER + ATTRIBUTION
This calculator provides an indicative estimate only. It is intended as a light-touch guide for communication and learning.
Results depend on the sector selected, the assumptions used (including displacement), and the limits of multiplier methods.
Source data: Stats NZ National Accounts / Input–Output tables (year ended March 2020). Compiled by Matatihi.
Privacy: This tool does not store your inputs.