
ECO INDEX
New Zealand’s Biodiversity - A Data Story
Introduction
Biodiversity in Aotearoa New Zealand is in a state of decline and has become a growing concern for citizens and the industries they work for. To determine what actions are needed, we are building a national Eco-index. This initiative is linking current investment in biodiversity by major land management sectors with the outcomes being achieved. Eco-Index will identify the best ways to direct actions – by the public and private sectors and by communities – to reverse biodiversity decline. It will guide land managers toward incremental actions that can cumulatively create intergenerational impact and reverse biodiversity decline in Aotearoa New Zealand.
Eco-Index is driven by data. We draw on multiple existing data sources and are pioneering new approaches to remote sensing and AI technologies to monitor biodiversity. Data on biodiversity are currently spread across multiple institutions. Much of the data we need to understand our biodiversity situation are available, however, they are not in a format that is easily accessible or comprehensible to a wide audience.
This web page has been created to provide some insights into the state of New Zealand’s biodiversity. It also illustrates how currently available data can be re-packaged to tell a story. Data have little value when they are kept hidden in little-visited locations. But when data are brought together in a visual and interactive way to solve complex values, they can provide immense value in charting our future biodiversity interventions.
National Land Cover
Land cover is a critical indicator of biodiversity. In the visualisation below, we show how regional landcover has changed between 1996 to 2012. We are particularly interested in indigenous (native) forest and scrubland cover which shows little to no change in the proportion of cover across Aotearoa from 1996-2012. Gisborne had a slight increase from 31% to 32% native forest and scrubland land cover. Taranaki, Marlborough and Southland had a slight decrease in native forest and scrubland land cover (40 to 39%, 38 to 37%, 44 to 43%, respectively).
Indigenous land cover alone is not enough to ensure flourishing biodiversity, however, it is a key ingredient and flat or decreasing trends in indigenous landcover are a clear indicator that change is required.
Exotic forestry has covered more than 15% of each Nelson, Bay of Plenty and Gisborne regions since 1996. More recent data, which will be added to these visualisations, indicate a significant increase in exotic forestry in some regions.
Data comes from the Ministry for the Environment: https://data.mfe.govt.nz/table/52469-land-use-land-cover-classes-1996-2001-2008-and-2012/data/

Wetlands
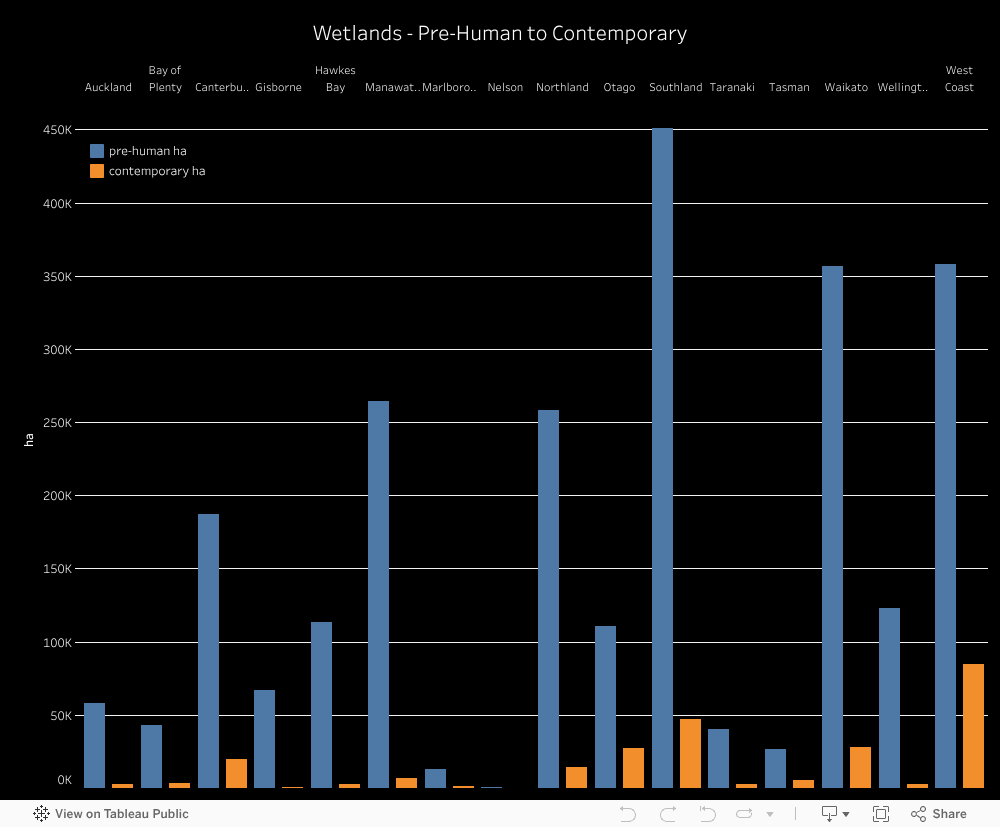
Wetlands are unique ecosystems because they are land areas regularly flooded, meaning that biodiverse water-tolerant plants and animals live there. Wetlands are incredibly valuable for purifying water and can hold a high volume of water thus reducing the effects of flooding and erosion and they store more carbon than a typical forest.
In Aotearoa, Nelson has had the largest loss of wetlands of 99.2 per cent (pre-humans there was 769 ha; currently there is 6 ha). Otago region has had the lowest percentage loss of wetlands of 75.6 per cent (pre-humans there was 110,804 ha; currently there is 27,050 ha).
Data comes from the Ministry for the Environment: https://data.mfe.govt.nz/table/52593-estimated-contemporary-and-pre-human-wetland-area-by-region-2008-estimate/data/
Māori Land Use
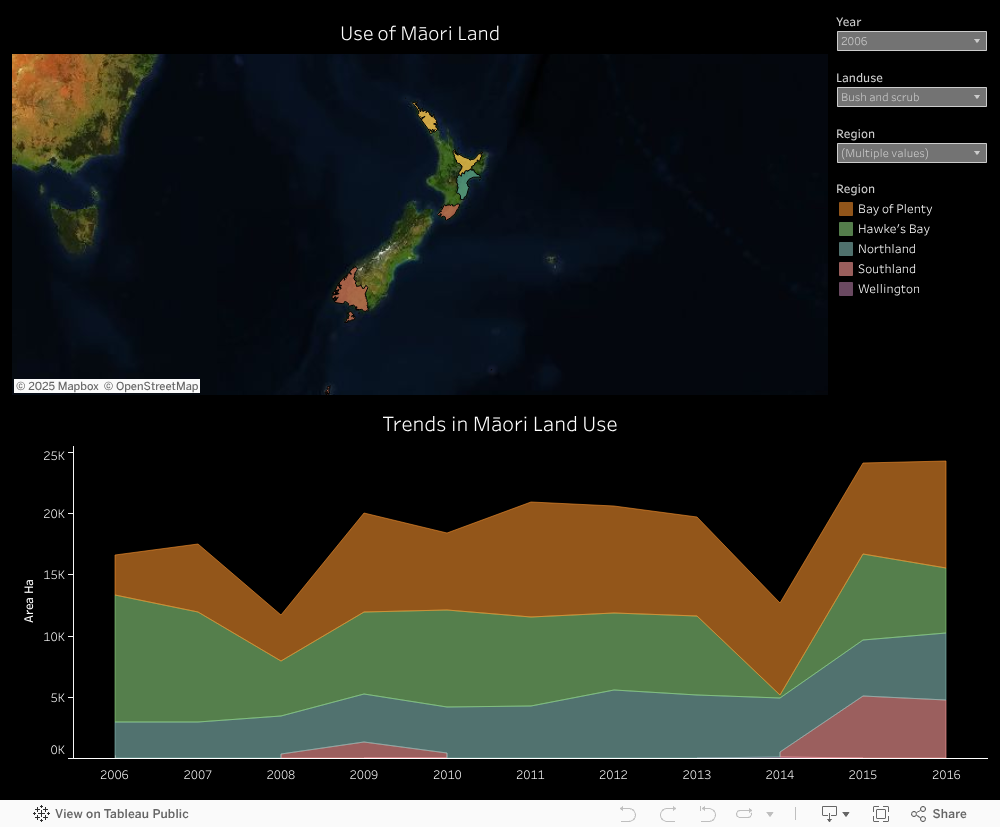
Primary production on Māori-owned land covers an area between 340,000 - 400,000 ha in Aotearoa from 2006 and 2016. Today, there is approximately 1.47 million ha of Māori-owned land in Aotearoa, around 5% of all of the land in Aotearoa.
Forestry on Māori land increased across all of Aotearoa by 67.6 per cent (from 65,864 ha in 2006 to 110,393 ha in 2016); the area in bush and scrub decreased by 32.5 per cent (from 111,710 ha to 75,351 ha).
Horticultural use on Māori-owned land only in northern-most rohe, mainly in Bay of Plenty and Gisborne areas. It increased by 65.1 per cent (from 1,616 ha in 2006 to 2,668 ha in 2016).
Other land not covered in the four main land-use types includes: tussock and danthonia, arable land, conservation plantings, riverbeds, wetlands, and all other land on the farm not elsewhere included.
Data comes from the Ministry for the Environment: https://data.mfe.govt.nz/table/95351-use-of-maori-land-land-use-200616/
See StatsNZ breakdown: https://www.stats.govt.nz/indicators/change-in-use-of-maori-land-for-primary-production
Bird Trends
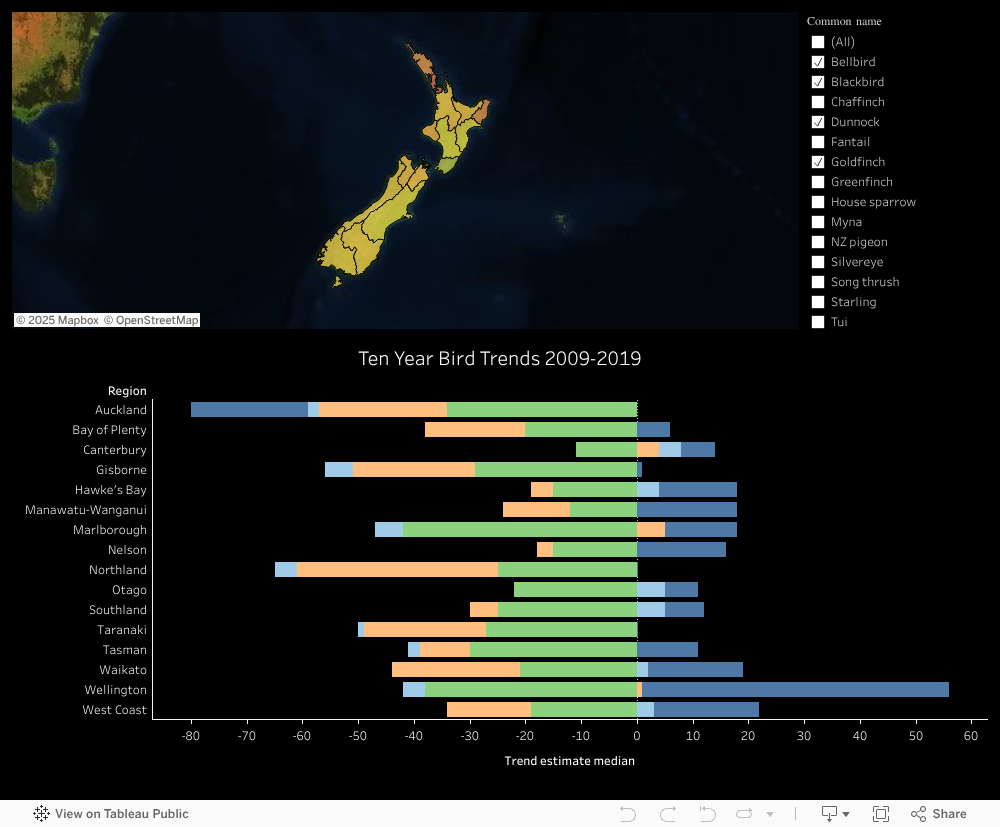
Since 2009, Aotearoa’s beloved tūī is increasing in population size across the whole country, along with the kererū (NZ pigeon) and pīwakawaka (fantail). Korimako (bellbird) are increasing in trend since 2009 in all regions except for Auckland where they appear to be decreasing.
Introduced birds, such as the song thrush, silvereye and goldfinch are decreasing in population size across all of Aotearoa since 2009. The greenfinch is increasing in population size across all of Aotearoa.
The Bay of Plenty region has the largest increase in overall bird population trends since 2009 and the Auckland region has the largest decreasing trends in overall bird populations.
Data comes from the NZ Garden Bird Survey: https://datastore.landcareresearch.co.nz/dataset/nzgbs-2019-trend-estimates
Hunting and Trapping Operations
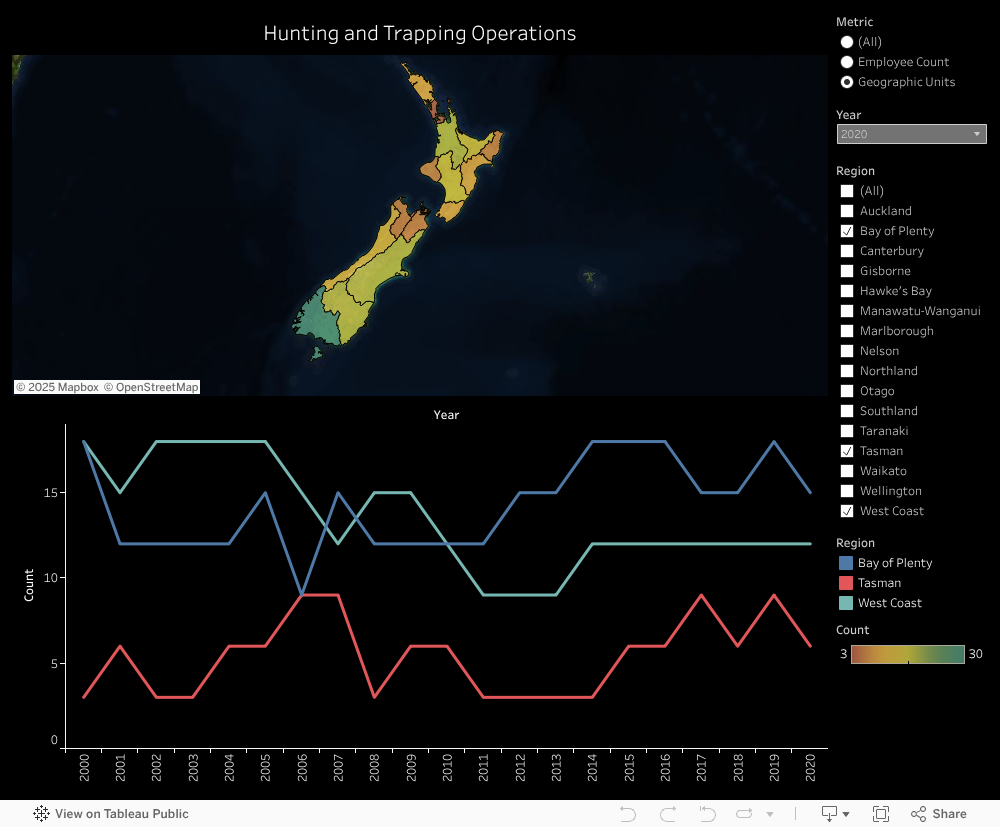
Hunting and trapping of introduced pest species help to protect the vulnerable native biodiversity in Aotearoa.
These data show how many people have been employed for hunting and trapping within each region for each year since 2000 (Employment Count).
The data also show the number of businesses operating in the hunting and trapping industry (Geographic Units) Otago, Gisborne and the Bay of Plenty regions have higher numbers of employed people who are involved with hunting and trapping than the other regions in Aotearoa. Recently (since 2018), this has started to change and those regions have fewer employed hunters/trappers and Canterbury and Manawatu-Whanganui regions are appearing to be employing more people each year to reduce pest species.
Data comes from StatsNZ: http://nzdotstat.stats.govt.nz/WBOS/Index.aspx?DataSetCode=TABLECODE7601
More Information
To determine what actions are needed, we are building a national Eco-index. This initiative is linking current investment in biodiversity by major land management sectors with the outcome being achieved. It will identify the best ways to direct actions – by the public and private sectors and by communities – in order to reverse biodiversity decline. It will guide land managers toward incremental actions that can cumulatively create intergenerational impact and reverse biodiversity decline in Aotearoa New Zealand.
In time, the Eco-index will indicate our country’s biodiversity performance, much like GDP indicates economic performance.